From Chaos to Clarity: Uncovering Insights from a Messy Dataset Using Python
- Shumaila Naz
- Aug 6, 2025
- 3 min read
In the world of data analysis, the journey often begins with a messy dataset. Data collected from various sources may come with inconsistencies, duplicates, and missing values, making it challenging to extract meaningful insights. This blog post will guide you through the transformation of a messy dataset into organized information using Python. The aim is to provide a practical, step-by-step approach that makes it easier to understand data cleaning and preparation.
Understanding the Importance of Data Cleaning
Before diving into the transformation process, it's crucial to grasp why data cleaning is necessary. Raw data may contain duplications, irrelevant entries, or erroneous values that can skew analysis results. Cleaning and preprocessing the data is essential for ensuring that the insights drawn from the analysis are accurate and reliable.
Poorly maintained datasets can lead to incorrect conclusions, which may have severe ramifications in decision-making processes. By employing Python, one of the most versatile programming languages, analysts can manipulate and clean data effectively. Python libraries like Pandas and NumPy are particularly powerful tools in this process.
Step 1: Loading the Dataset
The first step in the transformation process is loading your messy dataset into Python. This is typically achieved using the Pandas library, which provides robust functionalities for data manipulation.
```python
import pandas as pd
Load the dataset
data = pd.read_csv('path/to/dataset.csv')
```

Here, replace `'path/to/dataset.csv'` with the actual path of your dataset. Once loaded, the dataset is stored in a DataFrame object, which makes it easy to work with.
Step 2: Initial Inspection of the Data
After loading the dataset, it's essential to inspect its structure and content:
The `.head()` displays the first few rows of the DataFrame.
The `.tail()` displays the last few rows of the DataFrame.
The `.shape` displays the number of rows and columns of the DataFrame.
The `.info()` provides information about the data types and any missing value.
The `.describe()` provides a summary of statistics for the numerical columns of the DataFrame.
```python
Inspect the dataset
data.head()
data.tail()
data.shape
data.info()
data.describe()
```


Taking a moment to analyze the initial output gives insight into the types of issues you may face, such as missing values or improperly formatted data.
Step 3: Handling Missing Values
One of the most common issues in messy datasets is missing values. Depending on the extent of the missing data, you may choose to fill them in or drop rows/columns. Here is how to approach missing data:
Dropping Missing Values:
```python
Drop rows with any missing values
data = data.dropna()
```
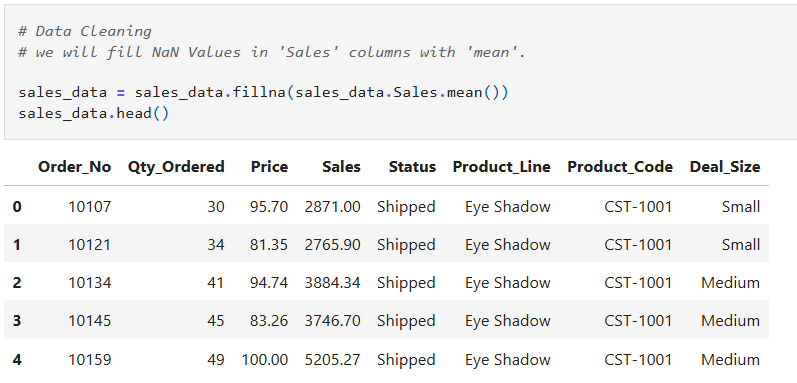
Filling Missing Values:
```python
Fill missing values with the mean of the column
data = data.fillna(data.column_name.mean())
```
The choice between dropping and filling depends on the dataset's context and the analysis required.
Step 4: Detecting and Removing Duplicates
Another common issue is duplicate entries, which can skew your analysis. Detecting and removing duplicates can be easily done using the following:
```python
Identify duplicates
duplicates = data.duplicated().sum()
print(f"Duplicates found: {duplicates}")
Remove duplicates
data = data.drop_duplicates()
```
This step not only cleans the dataset but also helps in maintaining the integrity of the analysis.
Step 5: Data Transformation
Once you've handled missing values and duplicates, the next step is to transform your data. This may involve normalizing data, converting data types, or even aggregating where necessary.
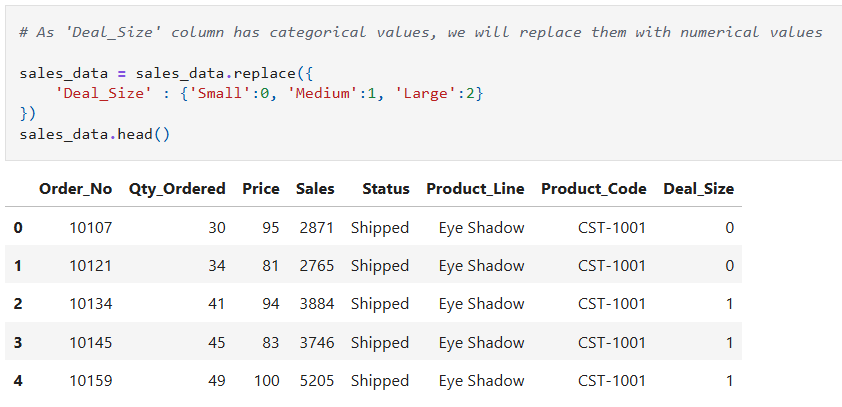
For example, you might want to change data type from float to integer or change categorical variables into numerical values for easier analysis:
```python
Convert data type from float to integer
data.column_name = data.column_name.astype(datatype)
Convert categorical variable to numeric
data = data.replace({
'coulmn_name' : {'categorical_value1':0, 'categorical_value2':1, 'categorical_value3':2}
})
```

Transformation enhances the dataset's usability and prepares it for analysis.
Step 6: Analyzing the Cleaned Dataset
With a cleaned and well-structured dataset, you're now in a strong position to conduct your analysis. Use various Python libraries to generate visualizations, run statistical analyses, or even build machine learning models.
```python
import matplotlib.pyplot as plt
import seaborn as sns
Example analysis: Visualizing a correlation heatmap
correlation_matrix = data.corr()
sns.heatmap(correlation_matrix, annot=True)
plt.show()
```
The insights gained from the analysis can lead to informed decisions, demonstrating the true power of rigorous data cleaning.

Conclusion
Transforming a messy dataset into clear insights is a crucial step in data analysis. By following the outlined steps—loading, inspecting, cleaning, transforming, and finally analyzing the dataset—you can unlock valuable information that drives decisions. Python's powerful libraries simplify these processes, allowing analysts to focus on leveraging insights rather than getting bogged down in messy data.
The next time you find yourself facing chaotic data, remember that with the right tools and approach, clarity is just a few steps away. Happy analyzing!
Inline Link
You can find the complete code on my GitHub repository.
Comments